Acoustic Wavenumber Spectroscopy
2018-07-13
Acoustic Wavenumber Spectroscopy (AWS) identifies damage in a two-dimensional scan of a structure on a pixel by pixel basis, by estimating the wavenumber of a structure's response to a steady-state, single frequency, ultrasonic excitation. A laser doppler vibrometer is used to measure a structure's response (known as lamb waves) to the ultrasonic excitation. When the lamb waves encounter a defect, (i.e. a crack, corrosion) the local wavelength of the lamb waves change and the change in wavelength can be detected using specialized signal processing techniques.
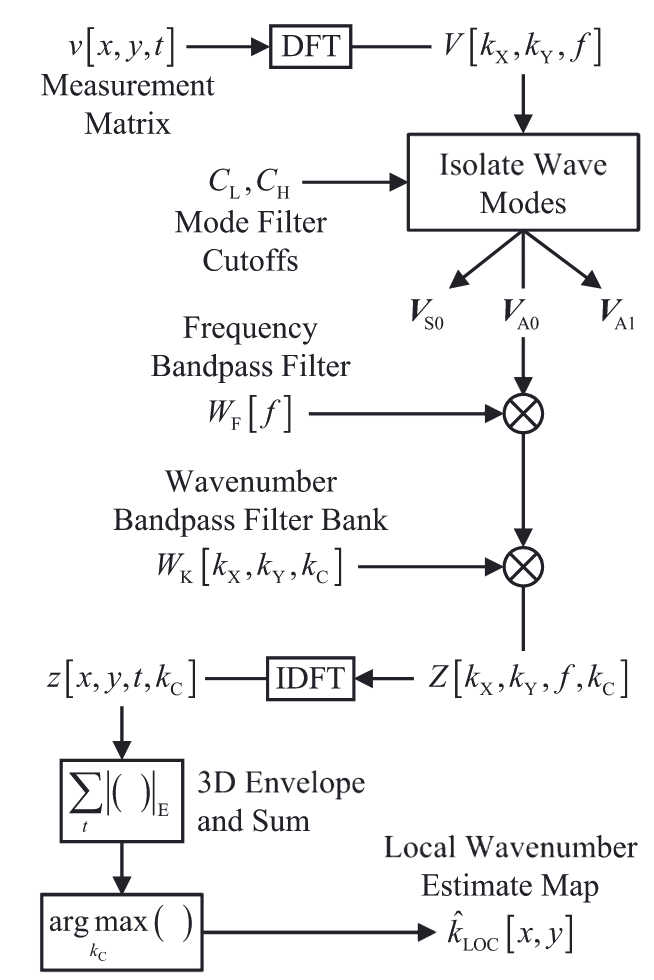
Scanning the surface of a structure with a laser doppler vibrometer results in a 3D measurement matrix consisting of x and y spatial dimensions and a time dimension for each x and y location. The measurement matrix is then transformed to the frequency-wavenumber domain where specific wave modes can be filtered out of the data. After wave mode and frequency filtering the data can be transformed back to the time domain where wavenumber can be estimated at each x and y location on the plate. The figure below descibes this process. For more detail see the paper "Structural Imaging Through Local Wavenumber Estimation of Guided Waves" by my mentor Eric Flynn and his co-authors.
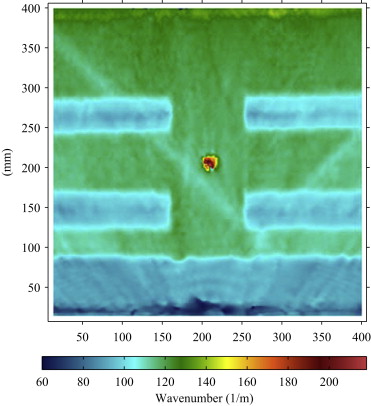
After processing the raw pattern, acoustic wavenumber spectroscopy can produce images like the one shown below, which shows a scan of a composite wing section. The bright blue areas are structural elements below the surface, while the bright red circle is a damaged area.
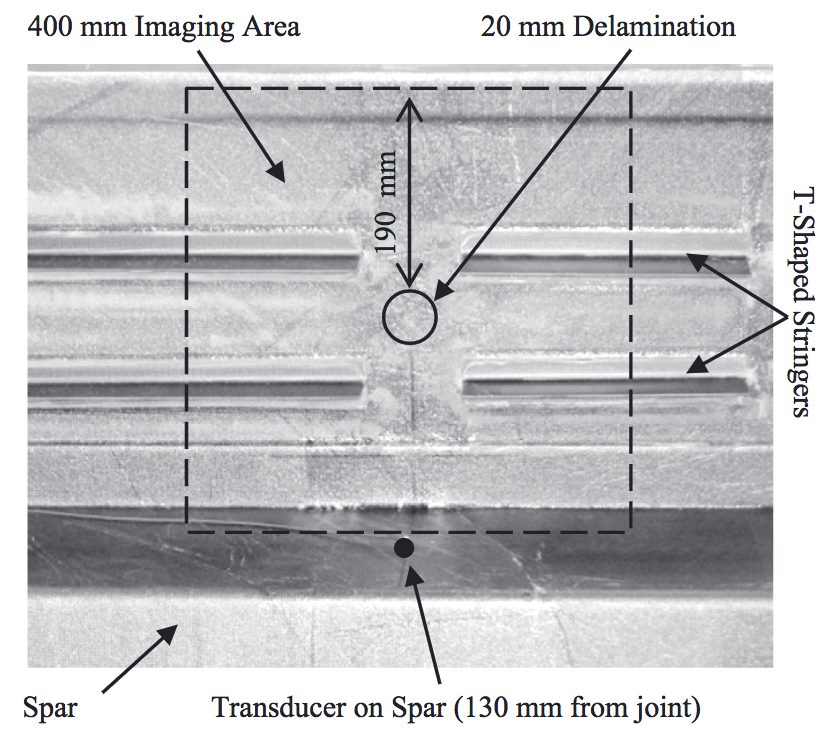
Commercial laser doppler vibrometers cost in the $60,000 to $80,000 range. While at Los Alamos National Laboratory I developed a much more compact, and simplified laser doppler vibrometer which costs on the order of $10,000. The key to achieving simplicity was leveraging some of the characteristics of acoustic wavenumber spectroscopy (AWS). Namely, that AWS works using a single, known, steady-state frequency. Signal to noise requirements can be relaxed as measurements can be filtered for that specific known frequency.
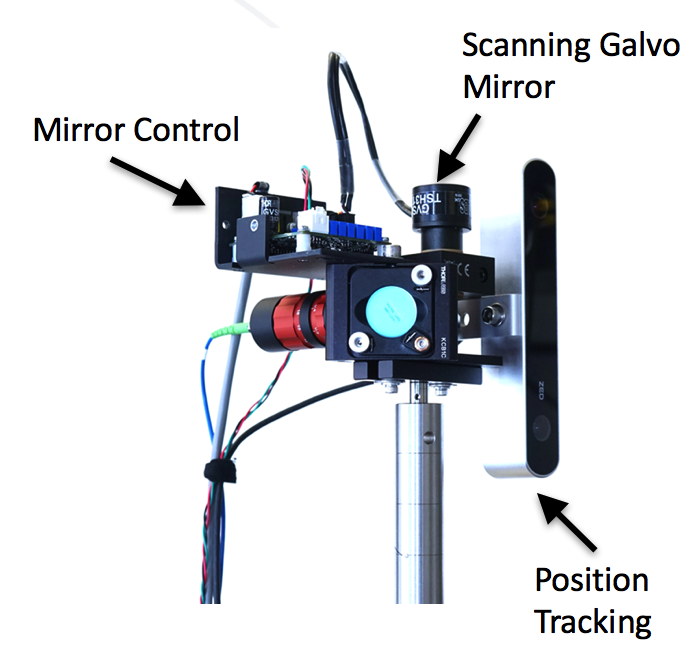
The raw images produced by my custom laser doppler vibrometer show a wave pattern produced by the ultrasonic transducer excitation. This wave pattern can then be fed through the signal processing algorithm described earlier to assess changes in spatial wavelength.
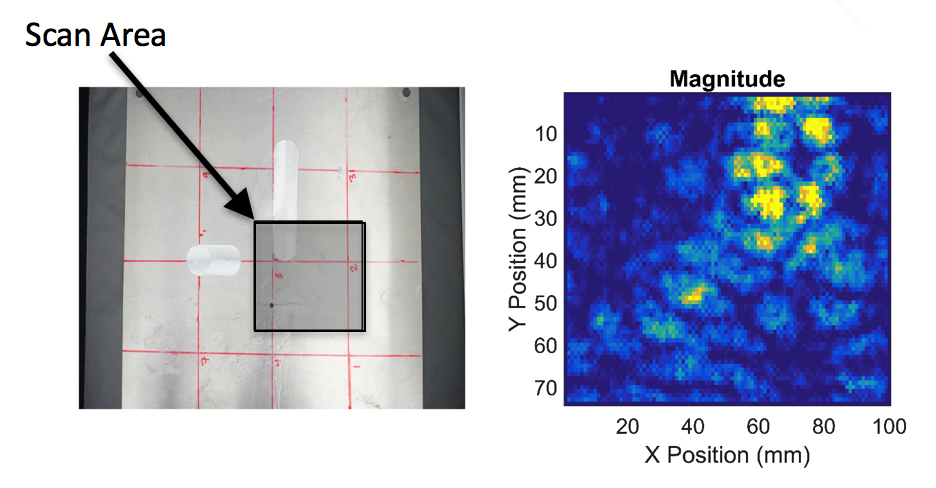
My cheap LDV could enable more widespread deployment of acoustic wavenumber spectroscopy systems.